Review Analysis Results
After an analysis completes, the analysis detail page opens the Report tab by default. Use this page to understand the environment, compare workbook risk, and decide what should happen next.
Report and Logs
Section titled “Report and Logs”- ReportUse this for migration planning: environment overview, usage, workbook tiers, workbook table, methodology, and workbook details.
- Logs & InfoUse this for job progress, processing messages, errors, partial progress, duration, and troubleshooting details.
- Download ExcelCompleted analyses can be exported for offline review and migration planning outside Antares.
Environment Overview
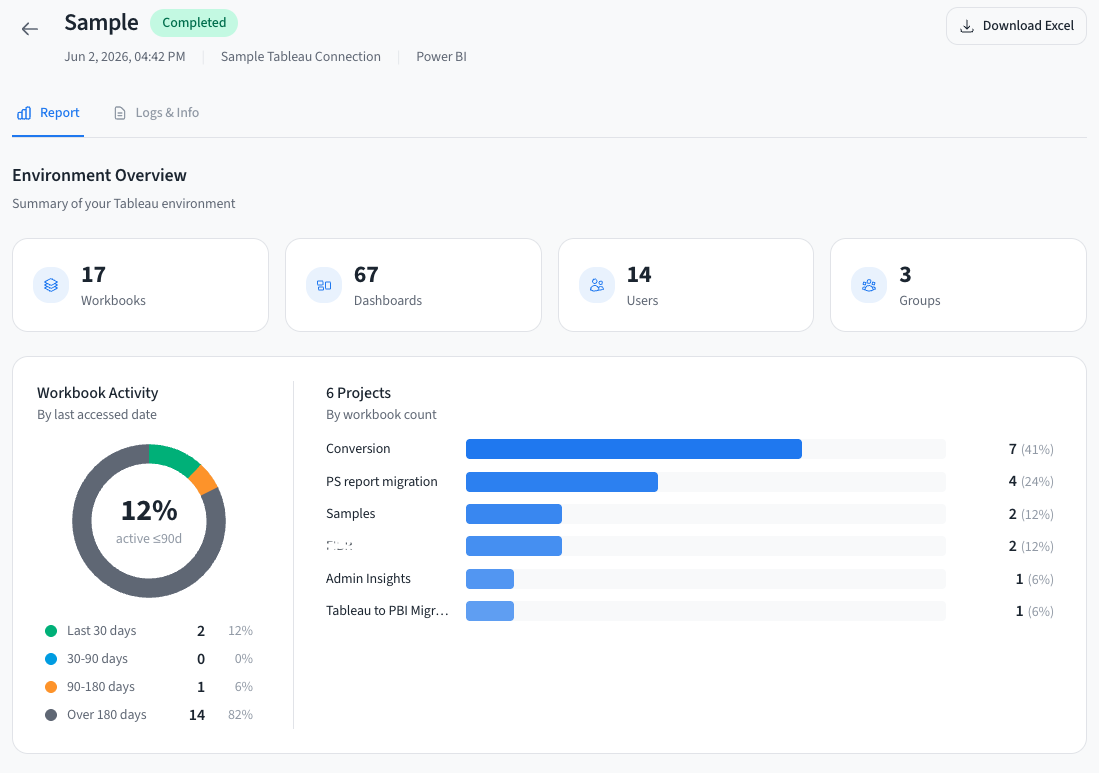
Section titled “Environment Overview”The environment overview appears for Tableau environment analyses. It summarizes the source environment and available capabilities.
| Section | What it tells you |
|---|---|
| KPI cards | Total workbooks and dashboards. Users and groups appear when Antares has access to those resources. |
| Workbook activity | Activity distribution by last accessed date, when usage data is available. |
| Projects | Workbook distribution across projects so you can identify large or migration-critical areas. |
| Capabilities | Shows which data sources were available for the report, such as users, groups, and usage data. |
Usage Analysis
Section titled “Usage Analysis”When usage data is available, Analyzer adds usage sections to help prioritize work.
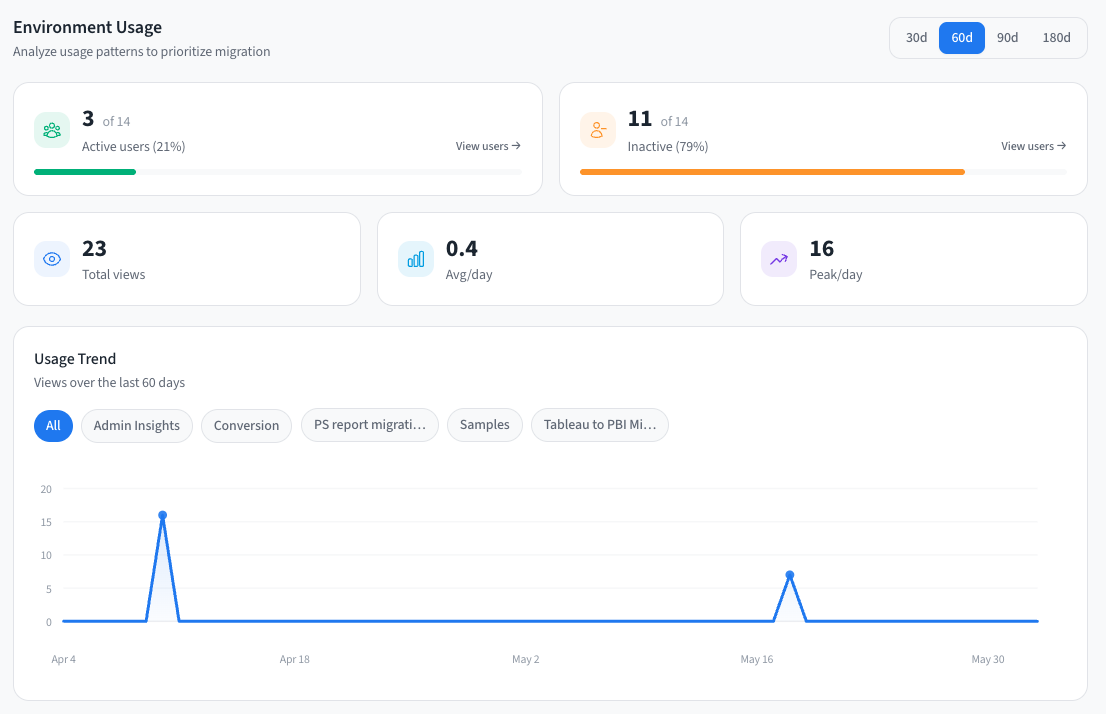
- Active and inactive usersCompare active and inactive users for the selected period. User modals can show user-level usage details.
- Usage trendReview views over time and filter by project to see demand patterns before planning migration waves.
- Usage by group or projectSee which groups and projects drive activity, when group and project usage data is available.
Use the period selector to compare recent usage windows before deciding whether a workbook is still important.
Workbook Table
Section titled “Workbook Table”The workbook table is the main portfolio triage surface.
| Signal | How to use it |
|---|---|
| Tableau tier | Shows how complex the workbook is to understand and maintain in Tableau. |
| Migration tier | Shows target-specific migration difficulty for the selected BI tool. |
| Views and users | Use when available to separate high-value workbooks from stale or low-use content. |
| Project and owner | Group workbooks by accountable team or migration wave. |
| Sorting, filtering, and export | Sort by usage or tier, search for a workbook, filter the list, and export the current workbook data to CSV. |
Open a workbook row to inspect its workbook detail page.
Methodology & Reference
Section titled “Methodology & Reference”The Methodology & Reference section explains why scores differ by target platform. It shows:
- The difference between Tableau complexity and target migration difficulty.
- The target-specific migration tier definitions.
- Tableau feature mappings to Power BI or Databricks AI/BI.
- Feature-level difficulty notes.
For the full methodology, see Migration Scoring.
Decide Next Action
Section titled “Decide Next Action”- MigrateThe workbook has manageable risk and should move into a migration wave.
- InvestigateThe workbook needs owner, usage, calculation, or dependency review before sequencing.
- RedesignThe workbook has patterns that should be rebuilt rather than translated directly.
- ArchiveThe workbook is high effort and low value, or is no longer used enough to justify migration.
- ConvertThe workbook is ready to send to Converter after review and source package preparation.